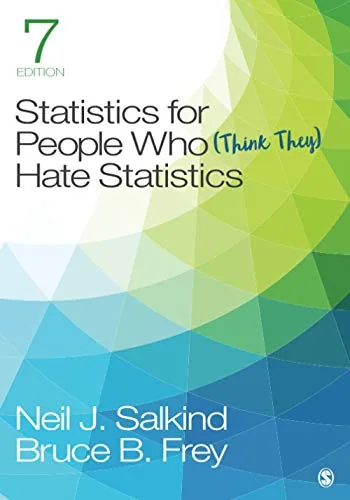
Statistics for People Who (Think They) Hate Statistics, 7th Edition
By Neil J. Salkind, Bruce B. Frey
About this ebook
Statistics for People Who (Think They) Hate Statistics, Seventh Edition, introduces statistical reasoning with an emphasis on concepts and interpretation. Neil J. Salkind and Bruce B. Frey cover descriptive measures, hypothesis testing, correlation, regression, and group comparisons. Examples, SPSS guidance, and APA-style reporting support students approaching introductory statistics.
Inside this title
Descriptive measures, hypothesis testing, confidence intervals, and statistical inference
Current listed price $25.99Regular price $85.00Digital ebook
The book starts with the ways data can be summarized, including averages, variability, and descriptive displays. From there, it develops the logic of inference: sampling, confidence intervals, significance, and the interpretation of hypothesis tests. Explanations connect procedures with the questions they address.
T-tests, analysis of variance, chi-square, correlation, and regression broaden the set of analytical tools. Effect size and power help distinguish statistical significance from the size and detectability of a relationship or difference. SPSS examples connect calculations with software output, while APA-style presentation addresses reporting. The seventh edition suits beginning students who want statistical ideas explained alongside their application in research and the interpretation of results.
Study guide included
Inside Statistics for People Who (Think They) Hate Statistics, 7th Edition.
An introduction to statistical reasoning for readers who expect to dislike it. Salkind and Frey explain descriptive measures, inference, hypothesis testing, correlation, regression, and group comparisons in plain terms, with SPSS guidance and APA-style reporting tied to interpretation rather than formula memorization.
The seventh edition starts with summarizing data through averages, variability, and descriptive displays. It then develops the logic of inference: sampling, confidence intervals, significance, and the interpretation of hypothesis tests. Each procedure is connected to the question it addresses rather than presented as a formula to apply. T-tests, analysis of variance, chi-square, correlation, and regression extend the toolkit. Effect size and power are used to separate statistical significance from the size and detectability of a difference. SPSS examples connect calculations with software output, and APA-style presentation addresses reporting. The book is aimed at beginning students who want concepts explained alongside their use.
Summarizing data
Descriptive statistics are presented as ways to see the shape of data before inference. Averages, variability, and displays each answer a different descriptive question.
Averages summarize a typical value
Variability describes spread
Displays reveal patterns that numbers can hide
Topic 1
Sampling and the logic of inference
Inference is treated as reasoning from a sample to a wider population. Sampling and confidence intervals introduce the uncertainty involved.
Samples stand in for populations
Confidence intervals express uncertainty
Inference depends on how a sample was drawn
Topic 2
Hypothesis testing and significance
Hypothesis tests are explained through the logic of comparison rather than ritual. Significance is presented as one piece of evidence, not a verdict.
Hypotheses set up competing expectations
Significance concerns probability under an assumption
A result can be significant yet small
Topic 3
Comparing groups
T-tests, analysis of variance, and chi-square are grouped because they address comparisons. The text links each to the kind of data it suits.
T-tests compare two groups
ANOVA extends comparison to more groups
Chi-square addresses categorical data
Topic 4
Correlation, regression, effect size, and power
Relationships between variables are examined alongside the strength and detectability of effects. This keeps statistical significance in perspective.
Correlation describes association, not cause
Regression models relationships among variables
Effect size and power address practical importance
Topic 5
SPSS output and APA reporting
Software output and reporting are treated as interpretation tasks. The reader is shown how to connect a calculation to a written result.
SPSS output must be read in context
APA style structures how results are reported
Reporting should match the analysis performed
Topic 6
Topic map
Descriptive Statistics and Data DisplaysTopic 1
Sampling and Confidence IntervalsTopic 2
Hypothesis Testing and SignificanceTopic 3
T-Tests and Analysis of VarianceTopic 4
Chi-Square and Categorical DataTopic 5
Correlation and RegressionTopic 6
Effect Size, Power, and APA ReportingTopic 7
Key takeaways
Statistical procedures are best understood through the questions they answer.
Significance and practical importance are not the same thing.
Software output still requires interpretation before it becomes a reported finding.
Beginning students in introductory statistics courses, researchers who want a conceptual refresher, and readers who need to interpret SPSS output and report results.
Topics covered
Statistics for People Who Think They Hate Statistics 7th Edition
Salkind and Frey statistics
introductory statistics
hypothesis testing
correlation and regression
ANOVA
effect size and power
SPSS and APA reporting
Questions about this ebook.
Edition, audience, and study-guide details at a glance.
What is Statistics for People Who (Think They) Hate Statistics, 7th Edition about?
Statistics for People Who (Think They) Hate Statistics, Seventh Edition, introduces statistical reasoning with an emphasis on concepts and interpretation. Neil J. Salkind and Bruce B. Frey cover descriptive measures, hypothesis testing, correlation, regression, and group comparisons. Examples, SPSS guidance, and APA-style reporting support students approaching introductory statistics.
Which edition of Statistics for People Who (Think They) Hate Statistics, 7th Edition is this?
This listing is for the 7th edition. Check the title, ISBN, and book details above before ordering, especially if your course or reading list names a specific edition.
Who is Statistics for People Who (Think They) Hate Statistics, 7th Edition for?
Beginning students in introductory statistics courses, researchers who want a conceptual refresher, and readers who need to interpret SPSS output and report results.
Does this page include a study guide?
Yes. This page includes an original study guide with six thematic sections, key takeaways, and a topic map for structured reading.