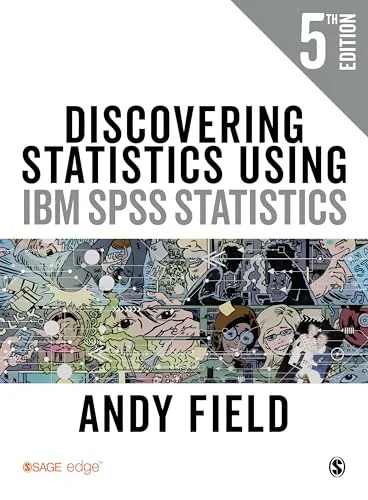
Discovering Statistics Using IBM SPSS Statistics, 5th Edition, International Edition explains quantitative analysis through concepts, practical examples, and SPSS walkthroughs. Andy Field covers measurement, hypothesis testing, group comparisons, regression, and mixed or multilevel models. The book is aimed at students and researchers who want to understand both analytical choices and software output.
Inside this title
Measurement, data summaries, hypothesis testing, and statistical interpretation
Current listed price $30.00Regular price $84.00Digital ebook
Variables, measurement scales, data summaries, and the logic of hypothesis testing introduce Field's approach to analysis. Explanations address the meaning of statistical results as well as the mechanics of obtaining them. Confidence intervals, effect sizes, and bootstrapping accompany the discussion of how evidence is evaluated and reported.
Step-by-step SPSS guidance and annotated output connect the ideas with applied work. Coverage includes t-tests, ANOVA, ANCOVA, nonparametric alternatives, correlation, multiple regression, logistic regression, repeated measures, mixed models, and multilevel analysis. This International Edition suits undergraduate and postgraduate coursework in the social and health sciences, as well as researchers seeking a guided account of statistical methods and their interpretation.
Study guide included
Inside Discovering Statistics Using IBM SPSS Statistics, 5th Edition (International Edition).
Field presents statistics as the construction and criticism of models. The book links research design, uncertainty and assumptions to a sequence that runs from inspecting data in SPSS through regression, group comparisons, factor analysis, logistic models and multilevel analysis, with each output tied back to a substantive interpretation.
Research questions and estimation logic come first. Readers then examine data, test assumptions and ask what significance testing can and cannot support. Regression becomes the base for comparing groups, adjusting for covariates and modeling change, and later chapters handle multiple outcomes, categorical responses and nested observations. SPSS walkthroughs show where a number comes from and where judgment must enter, while exercises make the reasoning behind each procedure visible rather than treating software as a black box. Reporting guidance runs throughout the text and interpretation.
From question to statistical model
A workable study begins with a question linked to observations, theory and a prediction that could fail. Recording a concept as a variable fixes what the numbers can stand for, and an experiment licenses different conclusions than an observational comparison. The SPINE chapter ties models, populations, parameters, estimates and inference together, insisting that standard errors and intervals communicate uncertainty under stated assumptions.
Design determines the claims available
Measurement choices define the data
Report uncertainty, not just a verdict
Chs. 1–2
Evidence, assumptions and visual checks
The data view holds cases and values; the variable view defines meaning and coding. Graphs expose distributions and relationships that summary statistics can hide. Unusual observations should be traced to their records, and unequal spread, curvature or dependence may invalidate a planned test. Rank methods help in some settings, while selective reporting and flexible analysis can make weak results look strong.
Graphs reveal what averages hide
Check unusual cases against records
Flexible analysis can inflate findings
Chs. 3–7
Correlation and the linear model
A correlation measures linear association; a regression predicts an outcome from an intercept and slopes. In a multiple model, each slope gives the change expected from one unit on that predictor while the others stay fixed, and sign, scale, interval and diagnostics make it meaningful. Coded predictors need a reference category, interactions capture moderation, and mediation describes a pathway whose causal reading depends on design.
Read coefficients in units and intervals
Hold other predictors fixed when interpreting
Interactions describe moderation effects
Chs. 8–11
Group comparisons and repeated measures
Independent and paired comparisons differ in whether observations are related, and the general linear model extends them to several groups with planned contrasts. Covariates adjust estimated means only under assumptions about their link to the outcome. Factorial designs estimate several factor effects plus interactions, and repeated measures call for analyses that respect dependence within a person.
Plan contrasts before scanning results
Covariate adjustment relies on assumptions
Within-person data need dependence-aware models
Chs. 10, 12–16
Multiple outcomes and latent factors
Multivariate tests ask whether groups differ across a related set of outcomes, a different question from many separate tests, and follow-up contrasts locate the source. Exploratory factor analysis seeks fewer latent dimensions behind correlated items; extraction, retention and rotation alter the loadings. Labels must be argued from item content and theory, and a factor remains a summary of shared variance rather than an observed score.
Joint tests differ from many separate tests
Follow-up contrasts locate the difference
Factor labels need theory and revision
Chs. 17–18
Categories and nested observations
Chi-square compares observed with expected counts, loglinear models describe associations among categorical variables, and logistic regression models binary outcomes on the log-odds scale. Odds ratios and predicted probabilities translate results, and coding must be checked before signs are interpreted. Multilevel models represent clustering across units and groups, using random intercepts or slopes as the question requires.
Check category coding before reading signs
Predicted probabilities aid communication
Nesting violates independence assumptions
Chs. 19–21
Chapter and section map
The SPINE of statisticsCh. 2
The phoenix of statisticsCh. 3
Exploring data with graphsCh. 5
The Linear Model (Regression)Ch. 9
GLM 4: Repeated-measures designsCh. 15
Exploratory factor analysisCh. 18
Categorical outcomes: logistic regressionCh. 20
Multilevel linear modelsCh. 21
Key takeaways
State the measurement, sampling unit and target quantity before fitting any model.
Report the effect and its uncertainty, then inspect fit and sensitivity to assumptions.
Choose a model that reflects both the outcome scale and dependencies among observations.
Students and researchers learning applied statistics with SPSS, especially in social science and health programs, plus instructors who want software work tied to design and interpretation.
Topics covered
SPSS statistics
hypothesis testing
linear regression
repeated measures
factor analysis
logistic regression
multilevel models
data visualization
Questions about this ebook.
Edition, audience, and study-guide details at a glance.
What is Discovering Statistics Using IBM SPSS Statistics, 5th Edition (International Edition) about?
Discovering Statistics Using IBM SPSS Statistics, 5th Edition, International Edition explains quantitative analysis through concepts, practical examples, and SPSS walkthroughs. Andy Field covers measurement, hypothesis testing, group comparisons, regression, and mixed or multilevel models. The book is aimed at students and researchers who want to understand both analytical choices and software output.
Which edition of Discovering Statistics Using IBM SPSS Statistics, 5th Edition (International Edition) is this?
This listing is for the 5th edition. Check the title, ISBN, and book details above before ordering, especially if your course or reading list names a specific edition.
Who is Discovering Statistics Using IBM SPSS Statistics, 5th Edition (International Edition) for?
Students and researchers learning applied statistics with SPSS, especially in social science and health programs, plus instructors who want software work tied to design and interpretation.
Does this page include a study guide?
Yes. This page includes an original study guide with six thematic sections, key takeaways, and a chapter and section map for structured reading.