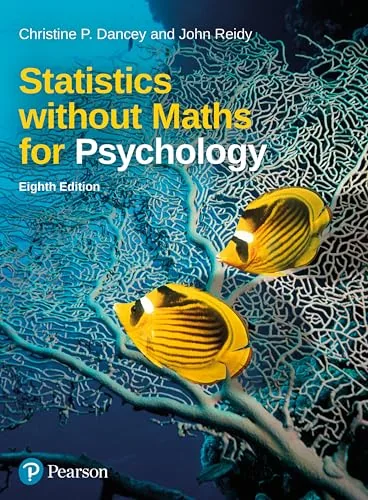
Statistics without Maths for Psychology, 8th Edition
By Christine P. Dancey, John Reidy
About this ebook
Statistics without Maths for Psychology, eighth edition, teaches statistical reasoning through concepts, psychological research examples, and SPSS guidance. Written for psychology undergraduates, it covers descriptive statistics, hypothesis testing, t-tests, analysis of variance, correlation, regression, and non-parametric methods. Annotated software output connects procedures with the interpretation and reporting of results.
Inside this title
Conceptual statistics taught through psychological questions and worked examples
Current listed price $24.00Regular price $48.00Digital ebook
Choosing a statistical test begins with the research question and the type of data collected. Dancey and Reidy explain levels of measurement, data handling, variability, significance testing, and the meaning of p-values through psychological examples. The conceptual presentation gives interpretation a central role alongside the steps of analysis.
Worked examples and SPSS instructions support data entry, preparation, and the reading of annotated output. Techniques include independent and paired t-tests, one-way and factorial ANOVA, post-hoc comparisons, correlation, regression, and non-parametric alternatives. Guidance on APA-style reporting connects analysis with communication. The eighth edition suits psychology students who need to select methods, understand software results, and explain findings in research coursework.
Study guide included
Inside Statistics without Maths for Psychology, 8th Edition.
Dancey and Reidy teach statistics through the questions psychologists actually ask, then let SPSS output carry the arithmetic. The emphasis falls on choosing a procedure that fits the design and explaining what the numbers mean in plain language, rather than memorising formulas.
Early chapters cover variables, study design and data entry, then descriptive statistics. Probability, sampling and significance come next, followed by correlation, tests for two conditions, and analyses with more groups or factors. Later material adds regression, covariate adjustment, factor analysis, multivariate analysis of variance and nonparametric alternatives. The recurring demand is to link software output to what was observed and to state how far the conclusion can travel. Worked examples, exercises and annotated screenshots make each step visible, and each chapter ends by asking for a written interpretation rather than a number alone.
Let the design pick the analysis
Between-participants designs give each person one condition; within-participants designs follow the same people across conditions, creating paired scores and a different error term. The measurement level of the outcome then limits which arithmetic is sensible. Before opening any menu, name the design and confirm that the data file maps rows and columns onto real participants and occasions.
Label each participant and each condition
Check pairing before any comparison
Keep codes and missing values documented
Chapters 1–2
Describe the evidence you gathered
Graphs reveal shape, clusters, extreme values and gaps that a summary can erase, while box plots foreground the median and central spread. The mean, median and mode each capture a different sense of typical, and standard deviation or interquartile range describe variation rather than centrality. Always report the count, the units and a measure of spread so magnitude and consistency are visible.
Look for skew before summarising
Report an average with its spread
Investigate outliers instead of deleting them
Chapter 3
Use probability to express doubt
A distribution of scores describes individuals; a sampling distribution describes statistics computed again and again under a model. The standard error therefore measures wobble in an estimate, not spread among people, which is the distinction behind error bars and confidence intervals. A p-value says how unusual the observed result, or something more extreme, would be if the null model held.
Keep individual spread and estimate spread apart
Weigh effect size, interval and cost
Do not treat a threshold as a cliff
Chapters 4–5 and 8
Match the method to the relationship
Pearson's r summarises direction and strength for a linear association, but only after a scatterplot has been checked for curvature, restricted range and influential points; a coefficient alone cannot order events or exclude a third variable. Regression states prediction in real units with added assumptions. For conditions, independent and paired t tests answer different structures, and count data call for a suitable test.
Plot before trusting a coefficient
Choose paired or independent deliberately
Report the difference in real units
Chapters 6–7, 9 and 12
Read several conditions together
An omnibus analysis of variance can show that the data sit badly with a model of equal means, yet it will not name the groups that differ. Means, intervals and planned contrasts supply that answer, and repeated measures demand attention to dependence within participants. In a factorial design, an interaction means the effect of one variable changes across levels of another, so a lone main effect may mislead.
Describe the pattern in group means
Plan comparisons rather than hunting
Plot the interaction before discussing it
Chapters 10–11
Add complexity with a reason
Multiple predictors, covariate adjustment, factor analysis and multivariate analysis of variance each answer a particular question, and each needs justification for why the variables belong in the same model. Rank-based methods suit ordered outcomes or situations where a parametric model fits poorly, changing how data enter the statistic. Choice should follow design, scale and intended inference, with the relevant assumption checked every time.
Say what the extra variables contribute
Name a factor from item content
Check assumptions for the chosen test
Chapters 12–16
Chapter and section map
Variables and Research DesignCh. 1
Introduction to SPSS and Descriptive StatisticsChs. 2–3
Probability, Sampling and DistributionsCh. 4
Hypothesis Testing and Issues of SignificanceChs. 5 and 8
Correlation and Two-Condition ComparisonsChs. 6–7
Measures of Association and Analysis of VarianceChs. 9–11
Regression and Covariate AdjustmentChs. 12–13
Factor Analysis, MANOVA and Nonparametric StatisticsChs. 14–16
Key takeaways
Decide whether scores are paired before choosing a test or laying out the data file.
Inspect the distribution and state the effect in real units before interpreting any p-value.
Explain an interaction through the pattern of means, naming where the difference changes direction.
Psychology undergraduates taking a first statistics module, plus research students who need to interpret SPSS output and report results without a strong mathematics background or prior training.
Topics covered
psychology statistics
SPSS guide
Dancey and Reidy
hypothesis testing
analysis of variance
nonparametric tests
research methods
undergraduate psychology
Questions about this ebook.
Edition, audience, and study-guide details at a glance.
What is Statistics without Maths for Psychology, 8th Edition about?
Statistics without Maths for Psychology, eighth edition, teaches statistical reasoning through concepts, psychological research examples, and SPSS guidance. Written for psychology undergraduates, it covers descriptive statistics, hypothesis testing, t-tests, analysis of variance, correlation, regression, and non-parametric methods. Annotated software output connects procedures with the interpretation and reporting of results.
Which edition of Statistics without Maths for Psychology, 8th Edition is this?
This listing is for the 8th edition. Check the title, ISBN, and book details above before ordering, especially if your course or reading list names a specific edition.
Who is Statistics without Maths for Psychology, 8th Edition for?
Psychology undergraduates taking a first statistics module, plus research students who need to interpret SPSS output and report results without a strong mathematics background or prior training.
Does this page include a study guide?
Yes. This page includes an original study guide with six thematic sections, key takeaways, and a chapter and section map for structured reading.