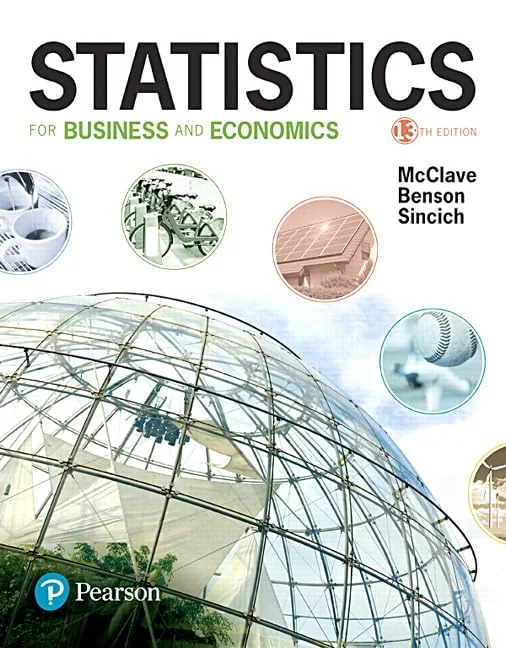
Statistics for Business and Economics, 13th Edition
By James T. McClave, P. George Benson, Terry Sincich
About this ebook
Statistics for Business and Economics, 13th Edition introduces statistical reasoning through business and economic applications. McClave, Benson, and Sincich connect data collection, probability, and analysis with the interpretation of sample evidence. It is written for introductory statistics students and readers who evaluate quantitative reports in business settings.
Inside this title
Sampling, probability, and inference in business contexts
Current listed price $10.99Regular price $18.00Digital ebook
The central thread of this textbook is inference: how observations from a sample support conclusions about a wider population. Surveys, experiments, and observational studies establish the context for descriptive measures, probability, sampling distributions, confidence intervals, and hypothesis tests. Business examples connect these methods with the questions that motivate statistical analysis.
Further coverage includes correlation, regression, analysis of variance, and categorical data. Worked applications and chapter exercises give students opportunities to examine both calculations and the meaning of results. The text suits introductory business statistics courses, including economics, finance, and management programs, as well as professionals reviewing the reasoning behind reported findings.
Study guide included
Inside Statistics for Business and Economics, 13th Edition.
An introductory treatment that trains readers to question where numbers come from before calculating with them. Data collection, probability, inference, and regression are developed through business cases, with repeated emphasis on matching a procedure to the design that produced the evidence and on explaining results in plain terms.
Statistical reasoning, in this book, starts with a judgment about provenance. A payroll file, a customer survey, and a controlled trial each permit a different kind of sentence, and the early chapters make that hierarchy explicit. Descriptive work follows: shape, center, spread, and the outliers that can dominate a summary. Probability and sampling distributions then explain how an estimate varies, which sets up confidence intervals, hypothesis tests, and the comparison of paired or separate groups. Designed experiments, contingency tables, and regression extend the toolkit, while later chapters cover process monitoring, forecasting, and rank procedures. Cases titled Statistics in Action ask readers to decide what a given analysis actually establishes.
Ask what the sample can support
Before a formula appears, the book asks two questions: which group is being described, and how were its members chosen? A complete operational file may still leave out transactions handled elsewhere, while a designed sample reaches a defined population. Random assignment earns a further privilege, since it makes treatment arms roughly alike before any outcome is measured.
Name the population and the unit
Distinguish records from designed samples
Explain what random assignment permits
Chs. 1–2
Probability as a model of variation
Chance enters as a way to describe uncertainty, not as a substitute for thinking. Events may overlap, hinge on prior information, or stand independent, and conditional statements keep the reference group visible. A random variable maps outcomes to numbers, and its distribution assigns likelihoods. Counting models differ when draws happen with or without replacement, a distinction that changes the arithmetic and the interpretation.
Keep the conditioning group explicit
Test independence before multiplying
See why replacement changes the count
Chs. 3–5
Estimate, then test, then decide
An interval pairs a point estimate with uncertainty drawn from the sampling distribution; its width reflects the data, the sample size, and the confidence chosen. A test, by contrast, addresses a stated claim about a population value. The p-value describes how surprising the data look under that claim, and it belongs next to the estimate and interval rather than in place of them.
State the parameter before computing
Read width against the decision threshold
Treat p-values as one piece of evidence
Chs. 6–8
Design comparisons across groups
Analysis of variance splits observed variability into the part tied to group membership and the residual part left inside groups. Randomization keeps those groups comparable on average; blocking first gathers similar units so the treatment contrast is cleaner. Factorial arrangements go further, revealing whether one factor's effect depends on the level of another. Categorical outcomes get their own treatment through expected counts and association tests.
Compare between-group with within-group spread
Block before assigning treatments
Check sparse cells before interpreting
Chs. 9–10
Build models that survive scrutiny
A regression line reports an average rather than a rule. In a simple model the slope gives the expected change per unit of the predictor; in a multiple model each coefficient holds the remaining predictors fixed. Indicator variables encode groups, and interaction terms let an effect bend with context. Prediction intervals for one future case run wider than intervals for the mean, because individual outcomes scatter around it.
Read a coefficient with the other terms held fixed
Plot residuals for shape and spread
Avoid extrapolating past observed inputs
Chs. 11–12
Monitor, forecast, and rank
Three tools serve three structures. Control charts read time-ordered measurements and flag departures from routine variation; time-series models project trend or seasonal patterns into the future; rank methods compare observations by order when the measurement scale or distribution makes a parametric route questionable. Each still rests on conditions, and each answers a narrower question than a general claim about the world.
Keep observations in sequence
Test forecasts against later data
State what a rank test compares
Chs. 13–15
Chapter and section map
Statistics, Data, and Statistical ThinkingCh. 1
Methods for Describing Sets of DataCh. 2
Sampling DistributionsCh. 5
Estimation with Confidence IntervalsCh. 6
Design of Experiments and Analysis of VarianceCh. 9
Categorical Data AnalysisCh. 10
Multiple Regression and Model BuildingCh. 12
Process Control, Forecasting, and RanksChs. 13–15
Key takeaways
State the population quantity and the study design before choosing a procedure.
A prediction for one case carries two sources of error: uncertainty about the fitted mean and scatter around it.
Ask whether a detectable difference is large enough to change what you would do.
Students taking a first statistics course in business or economics, and professionals returning to the subject who want cases, software support, and a clear account of assumptions behind each method.
Topics covered
business statistics
data collection methods
confidence intervals
analysis of variance
multiple regression
process control
forecasting methods
nonparametric tests
Questions about this ebook.
Edition, audience, and study-guide details at a glance.
What is Statistics for Business and Economics, 13th Edition about?
Statistics for Business and Economics, 13th Edition introduces statistical reasoning through business and economic applications. McClave, Benson, and Sincich connect data collection, probability, and analysis with the interpretation of sample evidence. It is written for introductory statistics students and readers who evaluate quantitative reports in business settings.
Which edition of Statistics for Business and Economics, 13th Edition is this?
This listing is for the 13th edition. Check the title, ISBN, and book details above before ordering, especially if your course or reading list names a specific edition.
Who is Statistics for Business and Economics, 13th Edition for?
Students taking a first statistics course in business or economics, and professionals returning to the subject who want cases, software support, and a clear account of assumptions behind each method.
Does this page include a study guide?
Yes. This page includes an original study guide with six thematic sections, key takeaways, and a chapter and section map for structured reading.