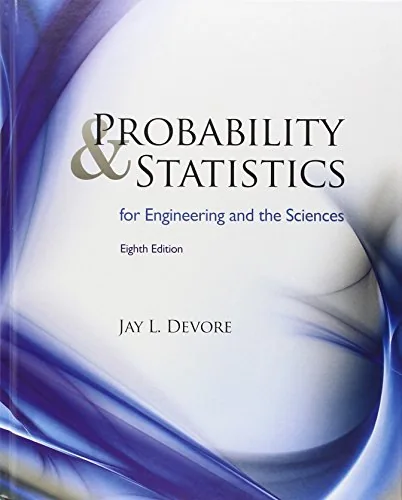
Cover of Probability and Statistics for Engineering and the Sciences, 8th Edition

Probability and Statistics for Engineering and the Sciences, 8th Edition

By Jay Devore

About this ebook

Probability and Statistics for Engineering and the Sciences, Eighth Edition, introduces statistical reasoning through engineering and scientific data. Jay Devore covers probability, distributions, estimation, testing, regression, and analysis of variance. Examples and case studies connect mathematical methods with the kinds of measurement and analysis problems encountered by engineering students.

Inside this title
  • Probability distributions, sampling variability, estimation, and hypothesis testing
Current listed price $17.00Regular price $31.00Digital ebook
Review order preview

Digital ebook. No physical book.

Format
Digital ebook
ISBN
9781133169345
Last updated
2026-11-03

What this book covers.

Descriptive statistics and probability establish the groundwork for studying random variables and discrete and continuous distributions. Sampling variability, point estimates, confidence intervals, and hypothesis tests then develop the logic of drawing conclusions from data. Applications keep the discussion anchored in engineering and scientific questions.

Regression, correlation, analysis of variance, and nonparametric methods extend the range of problems students can examine. Data sets and case studies come from several engineering disciplines, while statistical software output illustrates how calculations are presented and interpreted. The eighth edition is intended for students learning to connect quantitative methods with experimental measurements, uncertainty, model assessment, and comparisons among processes or populations.

Study guide included

Inside Probability and Statistics for Engineering and the Sciences, 8th Edition.

Devore builds a working command of statistics for engineering and science students. Probability lays the foundation, then estimation and testing turn data into defensible conclusions. Regression, analysis of variance and nonparametric tools widen the range. Real engineering data sets and software output keep the mathematics tied to measurement, uncertainty and inference.

The eighth edition begins with descriptive summaries and probability before introducing random variables and the discrete and continuous distributions used to model them. Sampling variability then motivates point estimates, confidence intervals and hypothesis tests, the core of inference. Applications drawn from several engineering fields keep the reasoning grounded. Later material covers correlation and regression, analysis of variance and nonparametric procedures. Statistical software output is included so students learn to read results as they are normally reported, connecting formulas with the interpretation of experiments and process comparisons.

Describing data and the language of probability

Descriptive statistics and probability establish the vocabulary for everything that follows. Data are summarised before uncertainty is formalised, so the move from description to inference has a clear starting point. Probability is introduced as the framework for reasoning about chance.

  • Descriptive summaries come before formal inference
  • Probability supplies the language of uncertainty
  • The sequence builds from description to reasoning
Topic 1

Random variables and distributions

Random variables translate outcomes into numbers, and distributions describe how those numbers behave. Discrete and continuous cases are treated as distinct modelling choices. The section gives students the tools to represent variability rather than merely summarise it.

  • Random variables convert outcomes into numerical form
  • Discrete and continuous distributions are modelled separately
  • Distributions characterise variability
Topic 2

Sampling variability and estimation

Samples vary, and inference begins by taking that variation seriously. Point estimates are presented alongside the uncertainty attached to them. The discussion prepares the ground for interval estimates and for judging how much a sample can support.

  • Sample-to-sample variation is unavoidable
  • Point estimates carry uncertainty
  • Sampling logic underpins formal inference
Topic 3

Hypothesis testing

Testing is presented as a structured way to compare data with a claim. The logic of null hypotheses, test statistics and error is developed in relation to engineering questions. Interpretation is emphasised alongside calculation.

  • Tests compare data against a stated claim
  • Errors and their consequences are part of the reasoning
  • Interpreting a result matters as much as computing it
Topic 4

Regression and correlation

Correlation and regression address relationships among measured variables. The book treats fitting, assessment and interpretation as linked steps. Applications show how models of association are used to describe and predict engineering data.

  • Regression models relationships between variables
  • Model assessment accompanies fitting
  • Association must be interpreted with care
Topic 5

Analysis of variance and nonparametric methods

Analysis of variance extends comparison to several groups at once. Nonparametric procedures provide alternatives when distributional assumptions are doubtful. Together they broaden the range of designs a student can analyse.

  • ANOVA compares means across multiple groups
  • Nonparametric tests relax distributional assumptions
  • Method choice follows from the design and the data
Topic 6

Topic map

  • Descriptive Statistics and ProbabilityTopic 1
  • Discrete Random Variables and DistributionsTopic 2
  • Continuous DistributionsTopic 3
  • Sampling and Point EstimationTopic 4
  • Confidence IntervalsTopic 5
  • Hypothesis TestingTopic 6
  • Regression and CorrelationTopic 7
  • Analysis of Variance and Nonparametric TestsTopic 8

Key takeaways

  • Inference rests on taking sampling variability seriously.
  • Probability and distributions supply the models that testing and estimation rely on.
  • Regression, ANOVA and nonparametric methods extend the same reasoning to relationships and group comparisons.

Undergraduate and graduate engineering and science students taking a first substantial course in probability and statistics.

Topics covered

  • Probability and Statistics for Engineering and the Sciences
  • Jay Devore 8th edition
  • engineering statistics textbook
  • probability distributions
  • hypothesis testing
  • regression and correlation
  • analysis of variance
  • nonparametric methods

Questions about this ebook.

Edition, audience, and study-guide details at a glance.

What is Probability and Statistics for Engineering and the Sciences, 8th Edition about?

Probability and Statistics for Engineering and the Sciences, Eighth Edition, introduces statistical reasoning through engineering and scientific data. Jay Devore covers probability, distributions, estimation, testing, regression, and analysis of variance. Examples and case studies connect mathematical methods with the kinds of measurement and analysis problems encountered by engineering students.

Which edition of Probability and Statistics for Engineering and the Sciences, 8th Edition is this?

This listing is for the 8th edition. Check the title, ISBN, and book details above before ordering, especially if your course or reading list names a specific edition.

Who is Probability and Statistics for Engineering and the Sciences, 8th Edition for?

Undergraduate and graduate engineering and science students taking a first substantial course in probability and statistics.

Does this page include a study guide?

Yes. This page includes an original study guide with six thematic sections, key takeaways, and a topic map for structured reading.

Keep your curiosity going.

More books from this subject area.

More engineering & applied sciences ebooks